Shutter Test
How to take the shutter test (approx 20min):

i)   Put the telescope at the domeflats position.
ii)  Adjust the domeflat's lamp such you get 2000 counts in a 3 sec exposure.
iii) Take the following 5 exposures (object: shutter, exptype: flat)

1) 1 exposure of 3 seconds
2) 1 exposure of 30 seconds
3) 1 exposure of 3 seconds
4) 1 exposure of 30 seconds, but pressing the pause button every 3 seconds.
5) 1 exposure of 3 seconds

And you are done!
If you have time, you can repeat the test replacing  3 by 4, 30 by 40,
and pressing pause in the 4th image every 4 seconds.

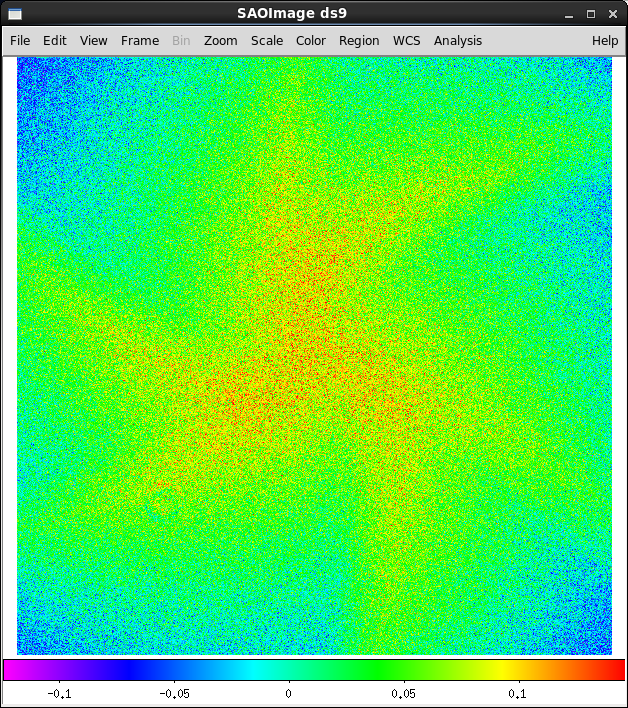
This is the resulting over-exposure whole detector pattern measured on Aug24th, 2014.

Linearity Test
How to take the linearity test (approx 1h30min):

1) Put the telescope at the domeflats position.
2) Adjust the domeflat's lamp such you get 2000 counts in a 3 sec exposure; set 'object' to 'linear'
and 'exptype' to 'flat'.
3) Run this macro taking the 4 quadrants simultaneously.

How to process the linearity test:

1) Copy the files into a csp machine.
2) Make a list of the images, one list for each quadrant.
For example:

	> ls ccd*fits | grep c1 > lt1
	> ls ccd*fits | grep c2 > lt2
	> ls ccd*fits | grep c3 > lt3
	> ls ccd*fits | grep c4 > lt4

3) Run the linearity test in the following way:

        > linear_test_swo_nc lt1  1 l1.txt
        > linear_test_swo_nc lt2  2 l2.txt
        > linear_test_swo_nc lt3  3 l3.txt
        > linear_test_swo_nc lt4  4 l4.txt

4) Send me the outputs (l?.txt files). Or, if you have a recent version of matplotlib in your pc/laptop
then you can run this python code there with the l?.txt files (csp machines
have an old version unfortunately).

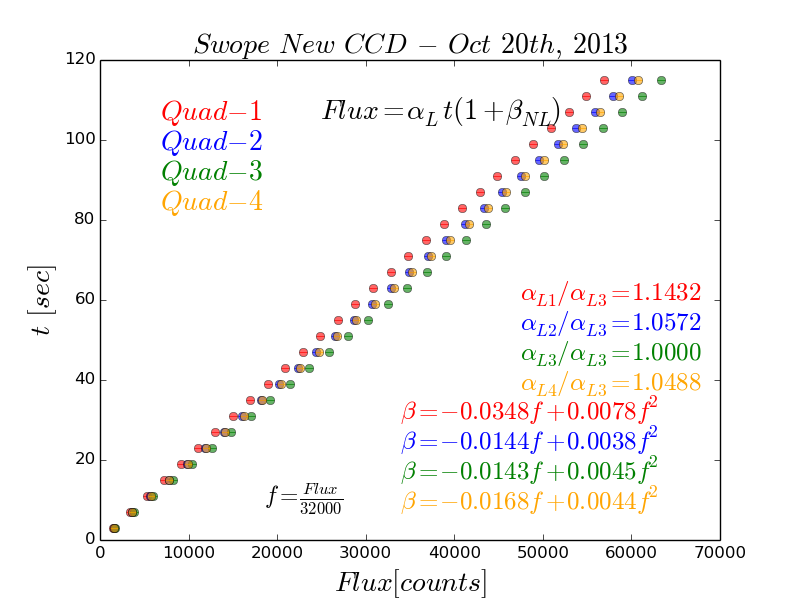
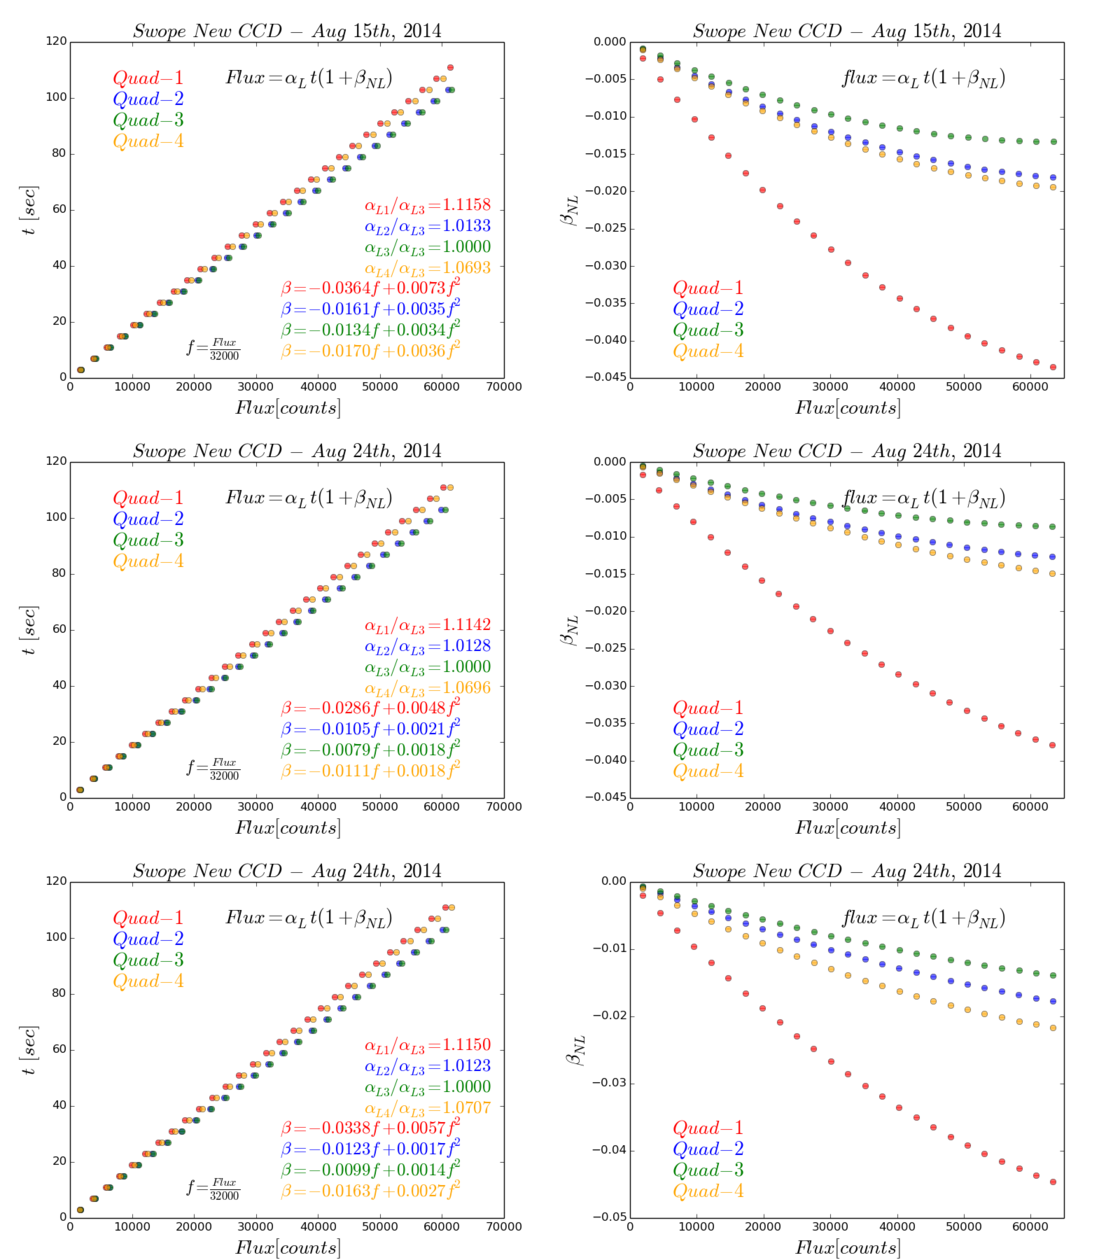
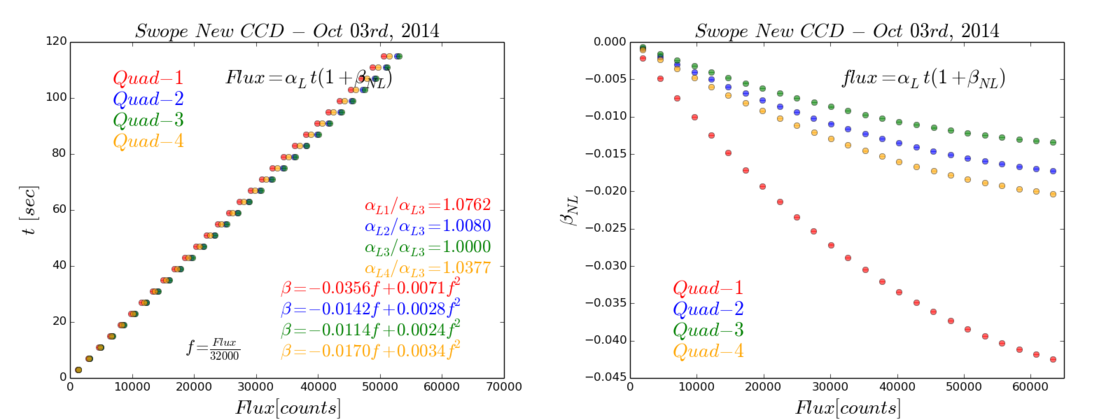
The result should something like this:

The following are linearity tests taken in Aug 2014, one in 15th and two in 24th.

The following is a linearity test taken in Oct 2014.

If you run the python code, check your numbers against the historical records:
| Date | Quadrant 1 |
| --- | α | β(1) | β(2) |
| 2013 Oct 18 | 1.141 | -0.035 | 0.0065 |
| 2013 Oct 19 | 1.140 | -0.033 | 0.0063 |
| 2013 Oct 20 | 1.143 | -0.035 | 0.0078 |
| 2013 Oct 21 | 1.146 | -0.034 | 0.0064 |
| 2013 Oct 22 | 1.139 | -0.035 | 0.0068 |
| 2014 August | 1.115 | -0.033 | 0.0057 |
| 2014 Oct 03 | 1.076 | -0.036 | 0.0071 |
|
| Date | Quadrant 2 |
| --- | α | β(1) | β(2) |
| 2013 Oct 18 | 1.059 | -0.018 | 0.0040 |
| 2013 Oct 19 | 1.058 | -0.017 | 0.0039 |
| 2013 Oct 20 | 1.057 | -0.014 | 0.0038 |
| 2013 Oct 21 | 1.066 | -0.020 | 0.0048 |
| 2013 Oct 22 | 1.050 | -0.014 | 0.0027 |
| 2014 August | 1.028 | -0.012 | 0.0017 |
| 2014 Oct 03 | 1.008 | -0.014 | 0.0028 |
|
| Date | Quadrant 3 |
| --- | α | β(1) | β(2) |
| 2013 Oct 18 | 1.000 | -0.017 | 0.0045 |
| 2013 Oct 19 | 1.000 | -0.017 | 0.0048 |
| 2013 Oct 20 | 1.000 | -0.014 | 0.0045 |
| 2013 Oct 21 | 1.000 | -0.012 | 0.0027 |
| 2013 Oct 22 | 1.000 | -0.012 | 0.0029 |
| 2014 August | 1.000 | -0.010 | 0.0014 |
| 2014 Oct 03 | 1.000 | -0.011 | 0.0024 |
|
| Date | Quadrant 4 |
| --- | α | β(1) | β(2) |
| 2013 Oct 18 | 1.051 | -0.022 | 0.0054 |
| 2013 Oct 19 | 1.052 | -0.023 | 0.0061 |
| 2013 Oct 20 | 1.049 | -0.017 | 0.0044 |
| 2013 Oct 21 | 1.058 | -0.027 | 0.0074 |
| 2013 Oct 22 | 1.056 | -0.017 | 0.0035 |
| 2014 August | 1.070 | -0.015 | 0.0027 |
| 2014 Oct 03 | 1.038 | -0.017 | 0.0034 |
|
Carlos


